
Over 800,000 Video Cards Benchmarked
The values for the video cards below are determined from thousands of PerformanceTest benchmark results and are updated daily.
Compare the performance of up to 5 different video cards
Step 1: Add Videocards from the search-able Videocard list page.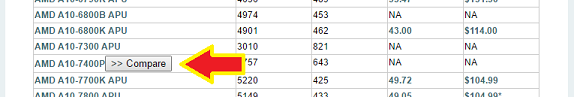
OR
Add Videocards from their individual pages.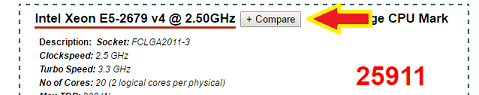
Step 2: Click the Compare button on the floating list on the right side of the screen.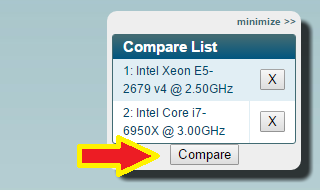
The results for your selected Videocards will now appear on this page!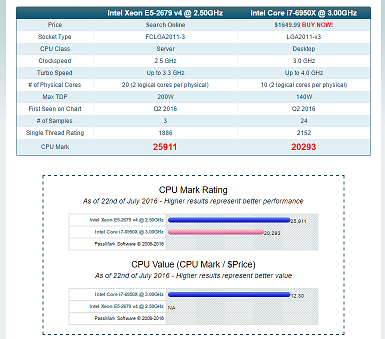
 High End
 Compare
 Video Card Mega List
 GPU Compute