Over 1,000,000 Video Cards Benchmarked
Below is a list of factors to take in consideration when viewing our graphs.
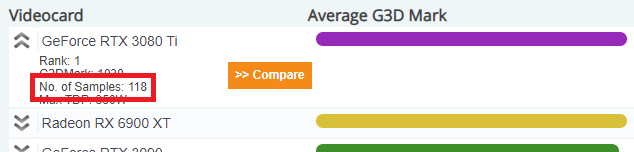
For a Video Card type to be included on the chart it needs to have had at least 2 submitted results. This is to help avoid a single really good or really bad result from throwing a Video Card type into a completely incorrect place in the chart. Due to the final score being an average of all benchmarks submitted for that Video Card it is still possible for one or more incorrect results to throw off the whole result when there is a small sample size. For this reason we have included information in the graph about how many Video Cards of that type have been benchmarked. To see this information simply move the mouse over the bar of the Video Card you are interested in. A higher sample size means the data is more likely to be accurate.
Overclocking is when a Video Card (or CPU) is made to run faster than it was designed for. Often people who like to test their computers and submit results are also the kind of people who like to overclock their computers. As such there are several benchmark results within the data where the Video Card has been overclocked. These results will artificially inflate a Video Cards score. In general the more samples a Video Card has the less likely its rating has been significantly affected by overclocking.
|
As a result of overclocking, your own results from non overclocked cards, might be slightly lower than the average presented in the graphs.
The PerformanceTest software is designed to run on several different versions of Windows. So the results presented are a mixture of results from Windows 2000, 2003, XP, Vista, 7, 8 & 10. These different OS have different levels of efficiency and as such a specific computer might perform better or worse depending on what OS is installed.
Between Dec 2002 and Aug 2007, Microsoft released about a dozen different versions of DirectX 9. (and then released DirectX 10, with backwards compatibility with 9). DirectX 11 was released in Feb 11 and is supported on Windows OS running Vista and later. DirectX 12 was released with the launch of Windows 10. The 3D benchmark results make heavy use of DirectX and different DirectX versions can effect the results. The results presented are from a mix of machines running different versions of DirectX.
In addition to testing your video card, the benchmark tests also require a fair amount of CPU power. So having a fast CPU will also benefit the 3D test results. In the case of a slow video card, the CPU performance isn't so critical (as most the bottle neck is in the video card). But in the case of a fast video card, the CPU performance is also critical. A fast CPU is required to feed the video card the data to display. The results presented are a mix of results from different machines with different CPUs. Note that the 3D tests are mostly single threaded, meaning that dual and quad core CPUs only perform slightly better than single core machines (depending on the device driver).
Different versions of Video Card drivers can also have an large impact on the result. In some cases some of the PC's might have had configuration issues leasing to sub-optimal results. The use of dual cards (SLI and CrossFire) can also effect the results. When a large number of samples are available this is not so much of an issue but when only a small number of results are available it can sway the results.
The rating the Video Card’s are given here represents their peak performance for the type of load generated by the tests and will not necessarily match the real world performance with any specific software application or game.
Due to the fact that these graphs are automatically generated the names of the Video Cards have been taken straight from the Video Cards' drivers. At times the naming of Video Cards by the manufacturers has been haphazard and because of this there will likely be some strange names in the graphs.
In some cases we have picked up names of rare or low volume Video Cards. Just because you haven't heard of a particular Video Cards type, doesn't mean it doesn't exist.
The system information gathered primarily deals with having a single video card installed. However, with some newer laptops and desktop system they contain both integrated video chip and a dedicated video card that might be active at the same time. In many cases, the cards are really different from each other. For example, a laptop may have Intel Core i7-2820QM processor along with a AMD Radeon 6970M dedicated video card. When collecting system information, PerformanceTest may pick up the Intel HD Graphics card, however, during testing the dedicated video card would take over. This can cause higher scores being reported for the integrated graphics card. This issue has been mostly addressed in PerformanceTest V8 onwards, but their still might be some instances where the integrated card is picked up instead.
Only results from version 9 and 10 of PerformanceTest have been used in these charts as the Video Card test from earlier versions of the software does not produce comparable results.
Due to the factors above, the results provide only a general guide to which card perform better. Cards which appear close together in the graph (with less than 10% difference in their scores) should be considered roughly equal in performance. Only larger differences should be considered statistically significant.
 High End
 Compare
 Video Card Mega List
 GPU Compute